

One in Five Virginia FQHC Patients Now Has No Insurance. The Leaders Are Already Adapting.
Virginia FQHCs · UDS 2025 · October 2026
Coverage is shrinking, cash is leaking, and quality scores now decide who sends you patients. Here is where the top quarter of Virginia's 26 FQHCs stands, line of business by line of business.
For FQHC CEOs, CFOs and medical directors · 5-minute read
I spent three days at VCHA's Annual Conference in Williamsburg last month, in rooms full of the people who run Virginia's FQHCs. Coverage, collections and quality were not three separate conversations. They were the same conversation, told by every CEO and CFO in the building. This piece puts numbers to what the room was already saying.
This analysis covers Virginia's 26 FQHCs, because that is the state we measured. If you lead an FQHC anywhere in the country and want the same look at your own numbers, reach out. We can do this for any state.
Want your own center's position on every number below, by payer, on one page? Email contact@carelyticsllc.com with your FQHC's name and city. It is free and takes one email.
Act 1: the ground is shifting under every FQHC
HRSA has published every Virginia health center's 2025 UDS report. We pulled all 26 of them. The first thing that jumps out is not a billing number. It is who walks in the door.
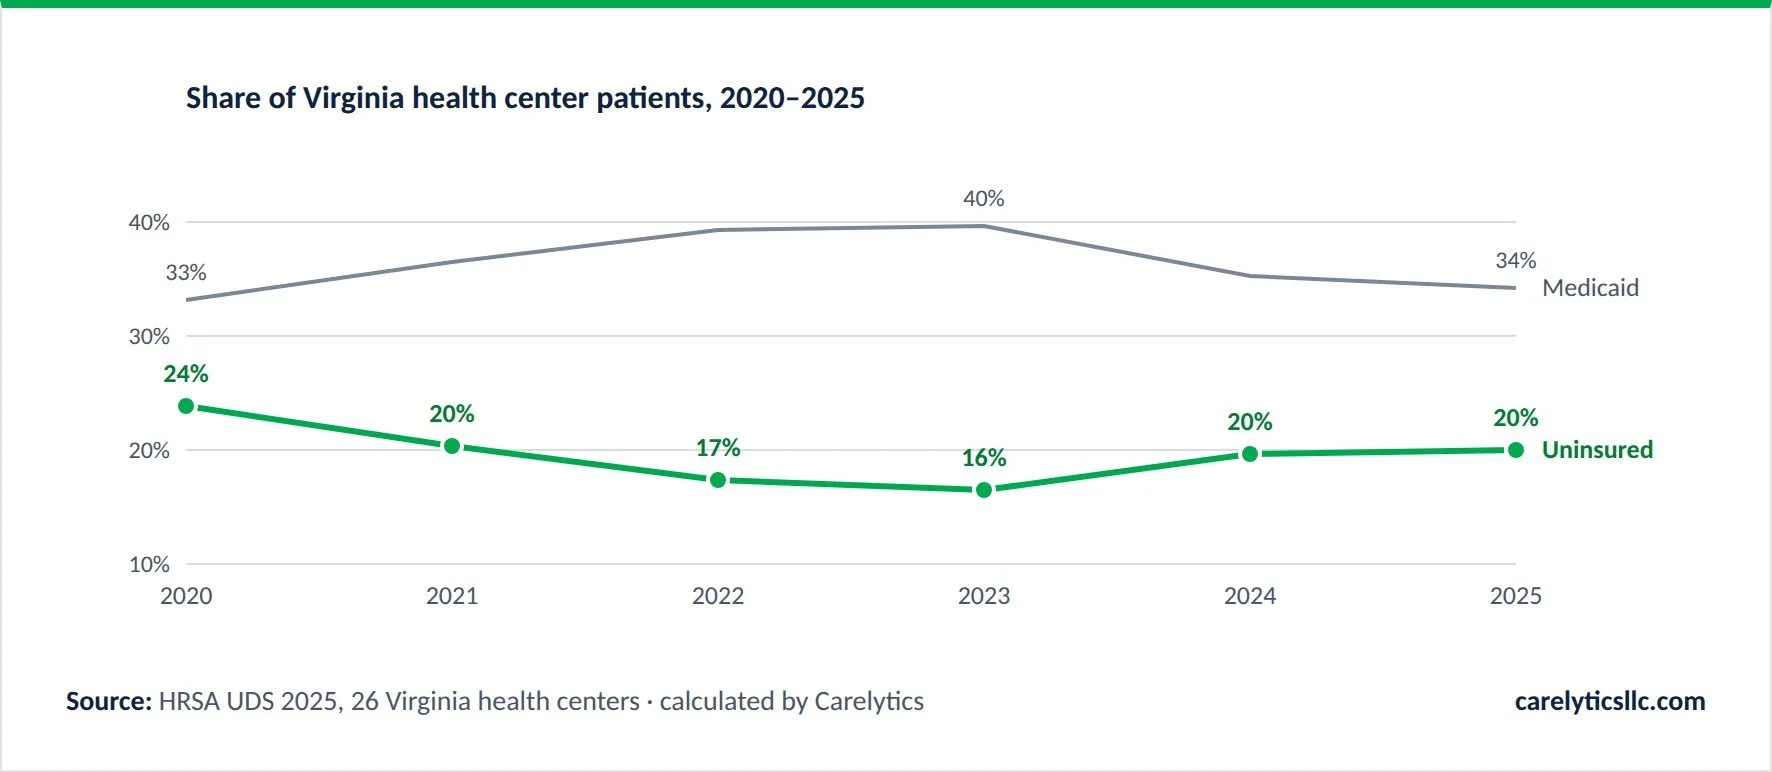
[Calculated] Share of all patients at the 26 Virginia health centers, by insurance, from UDS Table 4. 2025: Medicaid 34%, private and marketplace 26%, Medicare 16%, uninsured 20%.
In 2023, 16% of patients were uninsured. In 2025 it was 20%. That is about 17,000 more people with no coverage, in two years. Medicaid went the other way: from 40% of patients to 34%. Virginia's Medicaid unwinding did that.
Two more changes are already dated. [Source] Starting January 1, 2027, Medicaid adults ages 19 to 64 must show 80 hours a month of work, school or service to keep coverage (CMS rule of June 1, 2026). [Source] The extra marketplace tax credits ended on December 31, 2025; national marketplace sign-ups fell by 1.2 million (5%) for 2026. Virginia still had 370,086 people pick a marketplace plan for 2026, and many of them are your patients.
So what? Every patient who loses a card is a visit you still provide and do not get paid for. The 20% line is heading up, not down.
That is the pattern we heard in Williamsburg: the same three worries, in a different order, from nearly every table. This is not just a Virginia story, either. The work requirement and the end of the extra marketplace tax credits are both federal rules. Every FQHC in every state will see the same two things at the same time: more paperwork between a patient and their coverage, and a higher price for anyone who buys their own plan. Centers that start tracking this now, instead of when the first renewal denials show up, get months of head start on the budget hit.
Act 2: the leaders are already adapting
Here is how the field looks on the money and on quality. No center is named. Find yourself.
Money: what comes in for every $100 billed
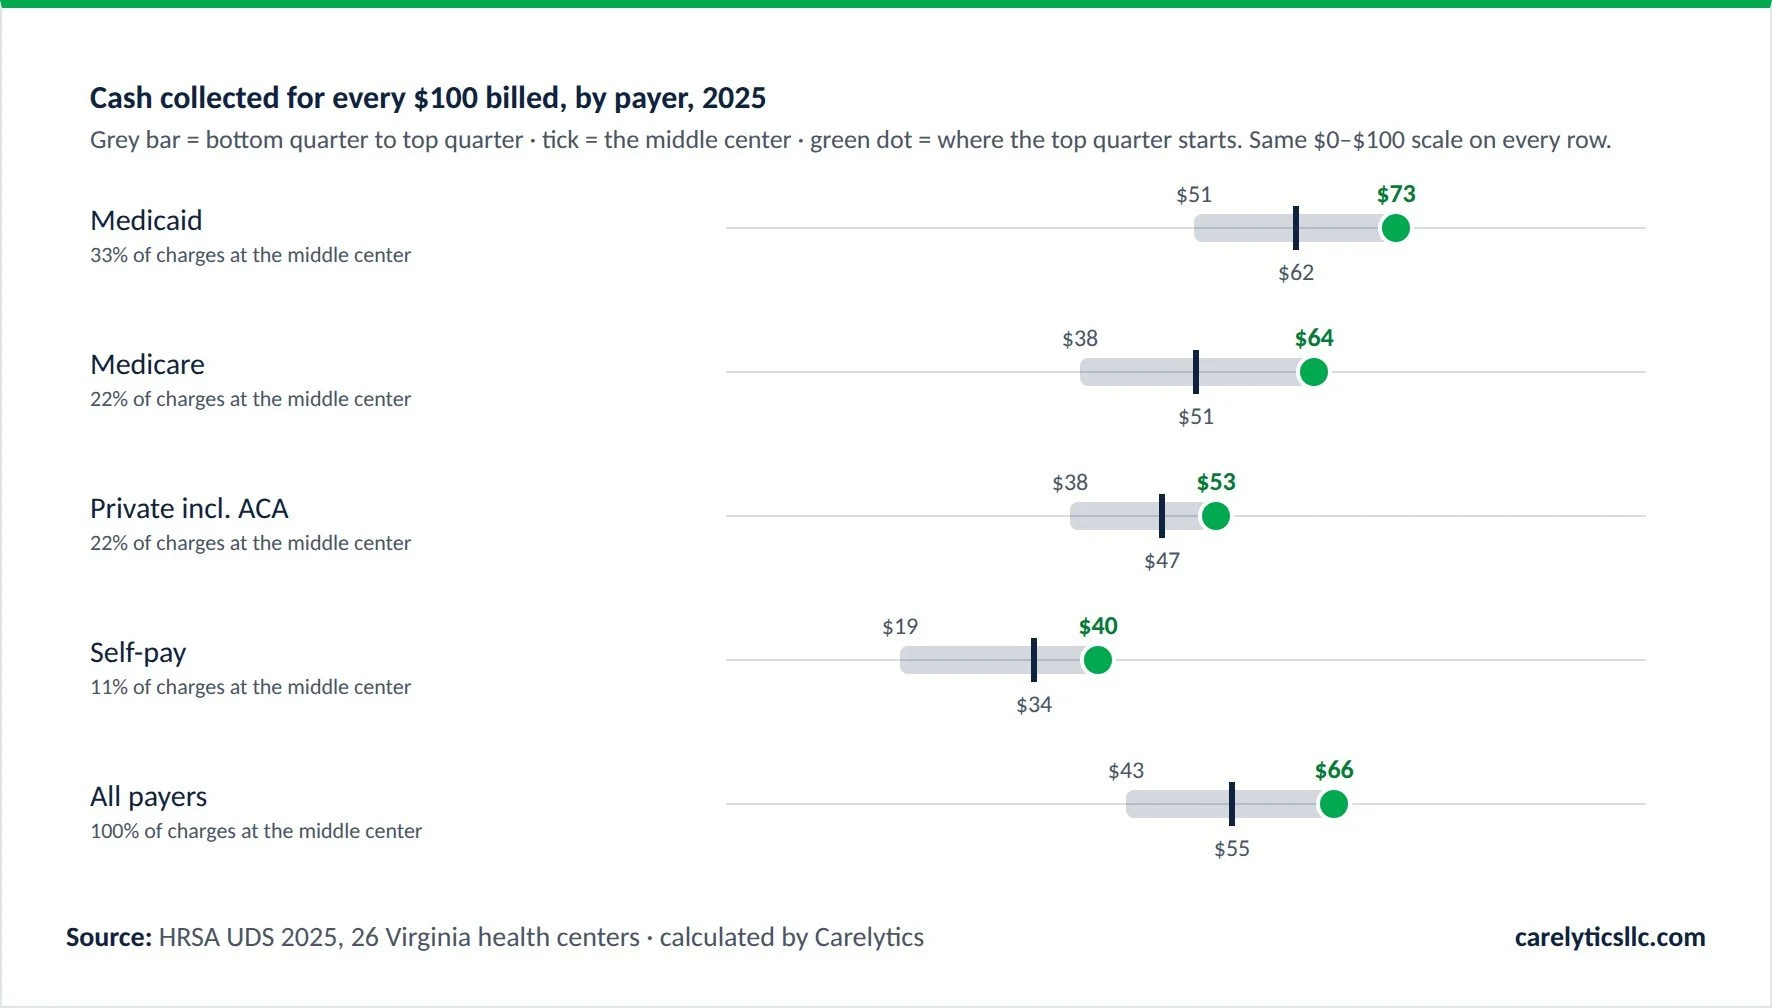
[Calculated] UDS Table 9D, cash collected ÷ charges billed, for the 16 of 26 Virginia centers that filed it. Three centers collect over $100 on Medicaid because of wraparound payments; they are kept.
The middle center collects $55 of every $100 it bills. The top quarter collects $66 or more. Medicaid is the strongest payer ($62). Medicare ($51) and private plans ($47) are the weak spots, and together they are 44% of what you bill. Self-pay brings in $34, and that share is growing.
So what? The middle filer bills about $13.5 million a year. Moving from the middle to the top quarter is worth about $1.5 million a year with no new patients and no new staff. Cost per patient tells the same story: top quarter $1,205, middle $1,579.
Quality: the second paycheck
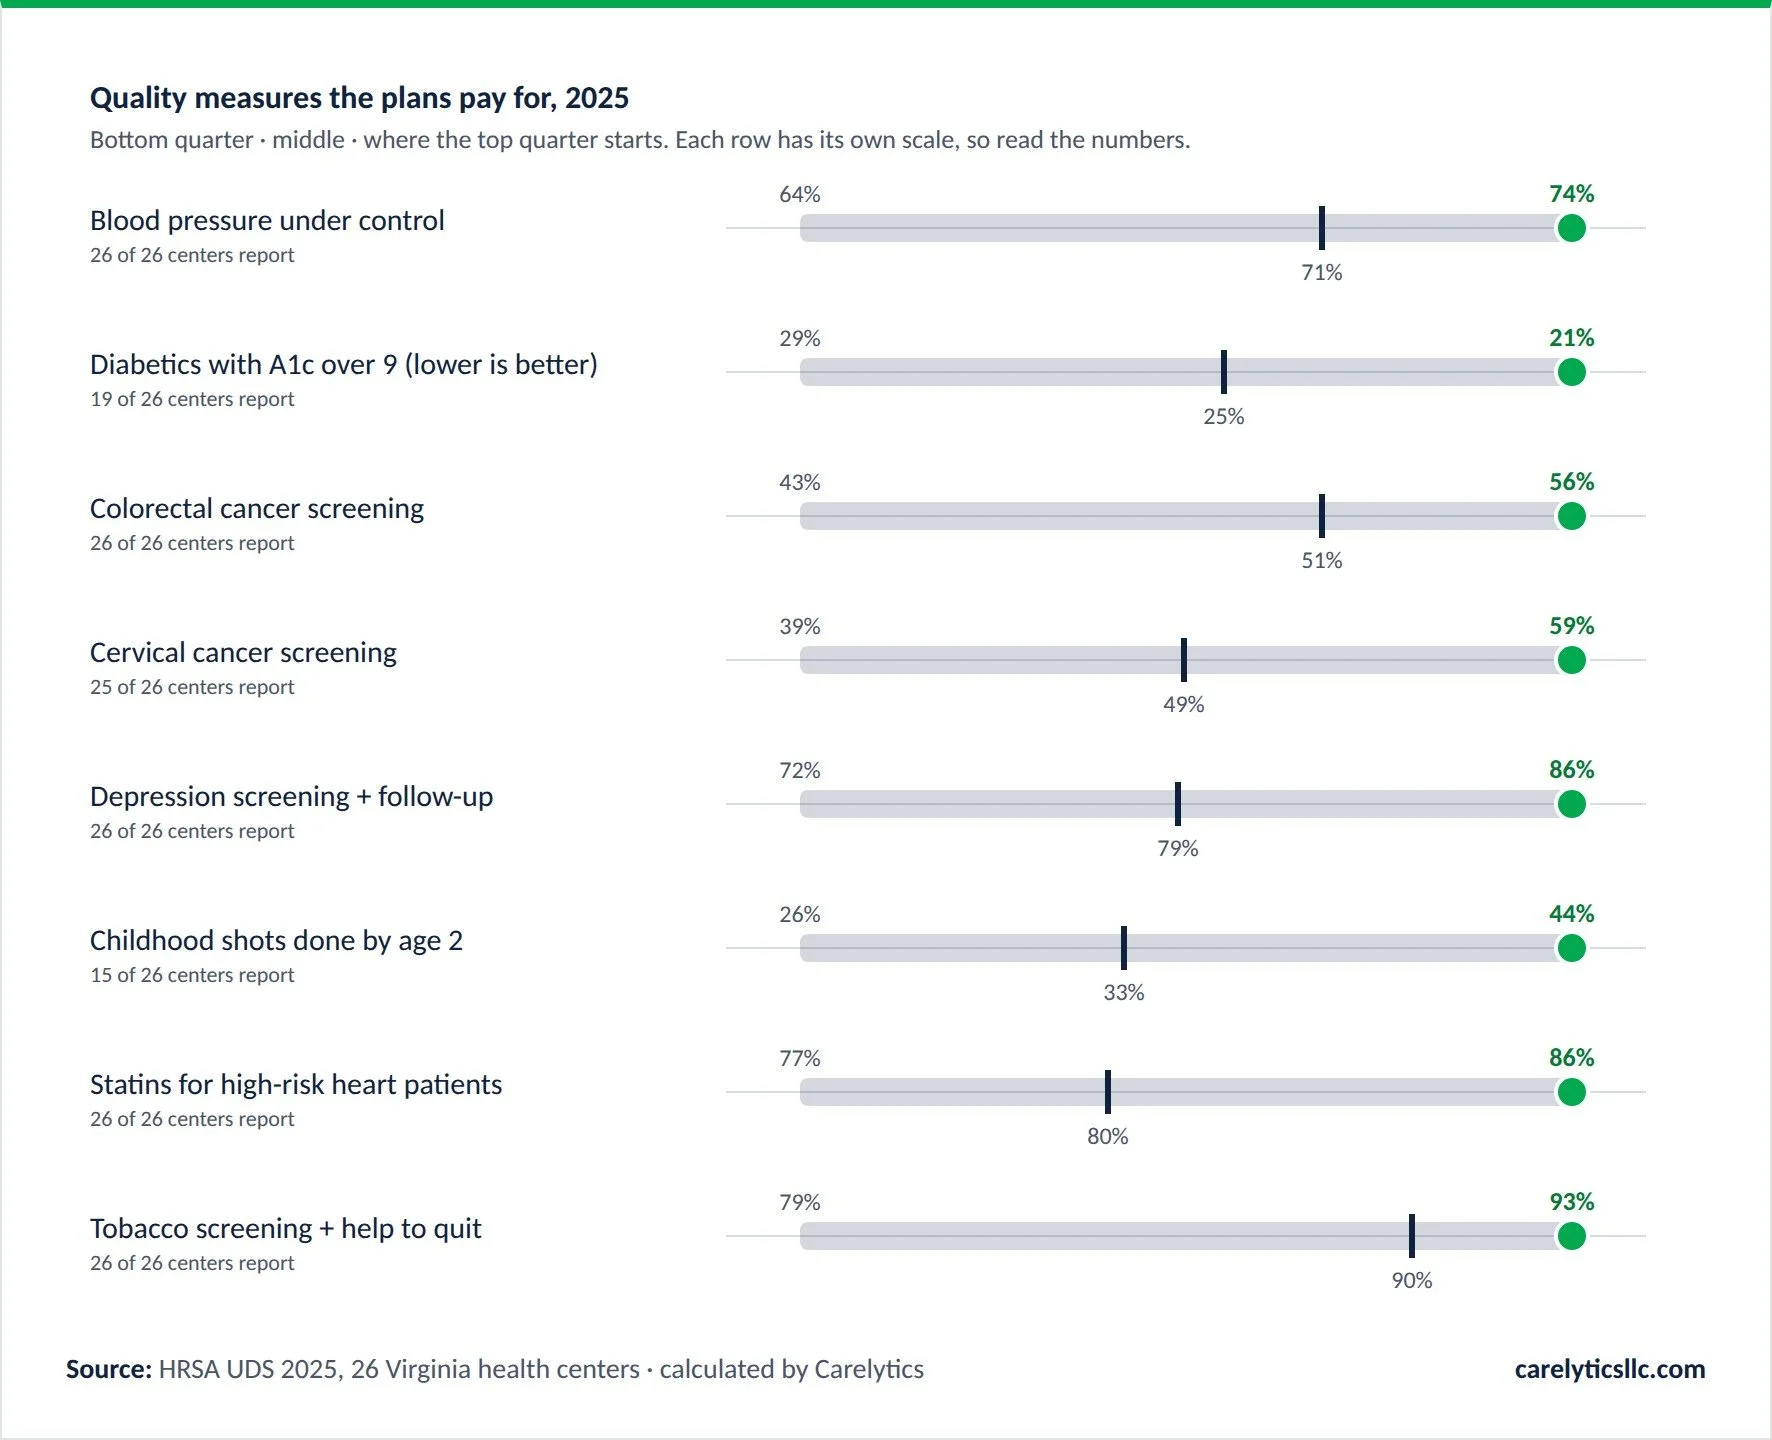
[Calculated] UDS Tables 6B and 7. Three centers reporting under 5% of diabetics with A1c over 9 were left out as likely reporting errors.
Cardinal Care plans and Medicare Advantage plans now pay for closed gaps and steer patients toward centers that close them. The top quarter is 3 points ahead on blood pressure, 4 on colorectal screening and 10 on cervical screening. One in four diabetics at the middle center has an A1c over 9; the top quarter holds it to 21%.
So what? Closing a 4-point screening gap is about one more patient in twenty-five. That is a list of names, not a strategy.
Act 3: three moves before the new year
Keep every patient covered. Build the list of Medicaid adults ages 19 to 64 who will face the 80-hour rule on January 1, 2027, and the marketplace patients whose premiums just rose. Measure: share of visits by uninsured patients, monthly.
Collect what you earned, by payer. Rebuild your Table 9D from claims and payments. Start with Medicare and private, where the middle center leaves the most. Measure: cash per $100 billed, by payer, monthly.
Close the gaps that pay. Blood pressure, A1c, colorectal and cervical, matched to the contract that pays for each. Measure: gap-to-top-quarter, in patients, by contract.
The centers at the top see these three numbers every month. The rest see them once a year, when the UDS is due.
How Carelytics helps
Free scorecard. Email contact@carelyticsllc.com with your FQHC's name and city. No BHCMIS number needed. We find you.
Your position on every number above. Coverage trend, cash per $100 by payer, cost per patient, quality gaps. One page, against your state's field.
No meeting required to get the first page.
If you want to act: we rebuild your Table 9D payer by payer and show the fix for each point.
We turn each quality gap into the patient list that closes it, tied to the contract that pays for it.
We build the three measures above into a monthly dashboard your CFO and medical director both read.
We work for FQHCs in any state, not only Virginia.
Carelytics is a Virginia SWaM-certified care gap closure and patient engagement company. We help rural and safety-net providers care for every patient on their panel, not just the ones a payer contract covers. Every number we give you says where it came from.
Questions or want your scorecard? Reach out to us at contact@carelyticsllc.com.
Sources
[Source] HRSA Uniform Data System, 2025 health center data, Tables 4, 6B, 7, 8A and 9D (HRSA data portal). [Source] CMS, Medicaid Community Engagement Requirement interim final rule fact sheet, June 1, 2026 (CMS fact sheet). [Source] CMS, Health Insurance Exchanges 2026 Open Enrollment Report and 2026 OEP State-Level Public Use File (CMS enrollment report). [Calculated] Shares, quartiles, collection rates (collected ÷ charges) and cost per patient (total accrued cost ÷ total patients) computed by Carelytics for the 26 Virginia centers in the 2025 roster. $13.5 million is the median annual charges among the 16 centers that filed Table 9D. No center is named.
