

Three Disenrollment Tiers in Medicare Advantage: How Plans Should Position for the CY2027 Bid

The CY2027 Medicare Advantage bid is due June 1, 2026. Less than three weeks. Most plans are making final decisions on premium, MOOP, supplemental envelope, network changes, and Star Ratings investment. The decisions made now drive everything members see at AEP 2026 for January 1, 2027 effective dates.
We pulled every contract's CY2024 disenrollment rate from the CMS Star Ratings 2026 publication — 525 contracts in total — and cut them into three tiers using the actual industry distribution. The tier you sit in changes which five things you should be focusing on before the bid locks.
This post does three things: (1) defines the tiers cleanly using empirical quartiles rather than round numbers; (2) shows the data behind why each tier behaves the way it does; (3) gives five focus areas per tier for the bid.
How the tiers cut
The 525 contracts that reported CY2024 disenrollment look like this:
Tier 1 - Low-churn: 135 contracts at or below the 25th percentile (under 6% disenrollment). Mean 3.9%.
Tier 2 - Mid-pack: 259 contracts between Q1 and Q3 (7-23% disenrollment). Mean 14.0%.
Tier 3 - At-risk: 131 contracts above the 75th percentile (over 23% disenrollment). Mean 33.7%, max 58%.
The industry median is 14%. The mean is 16.3%. One in four contracts loses more than 1 in 5 members every year.
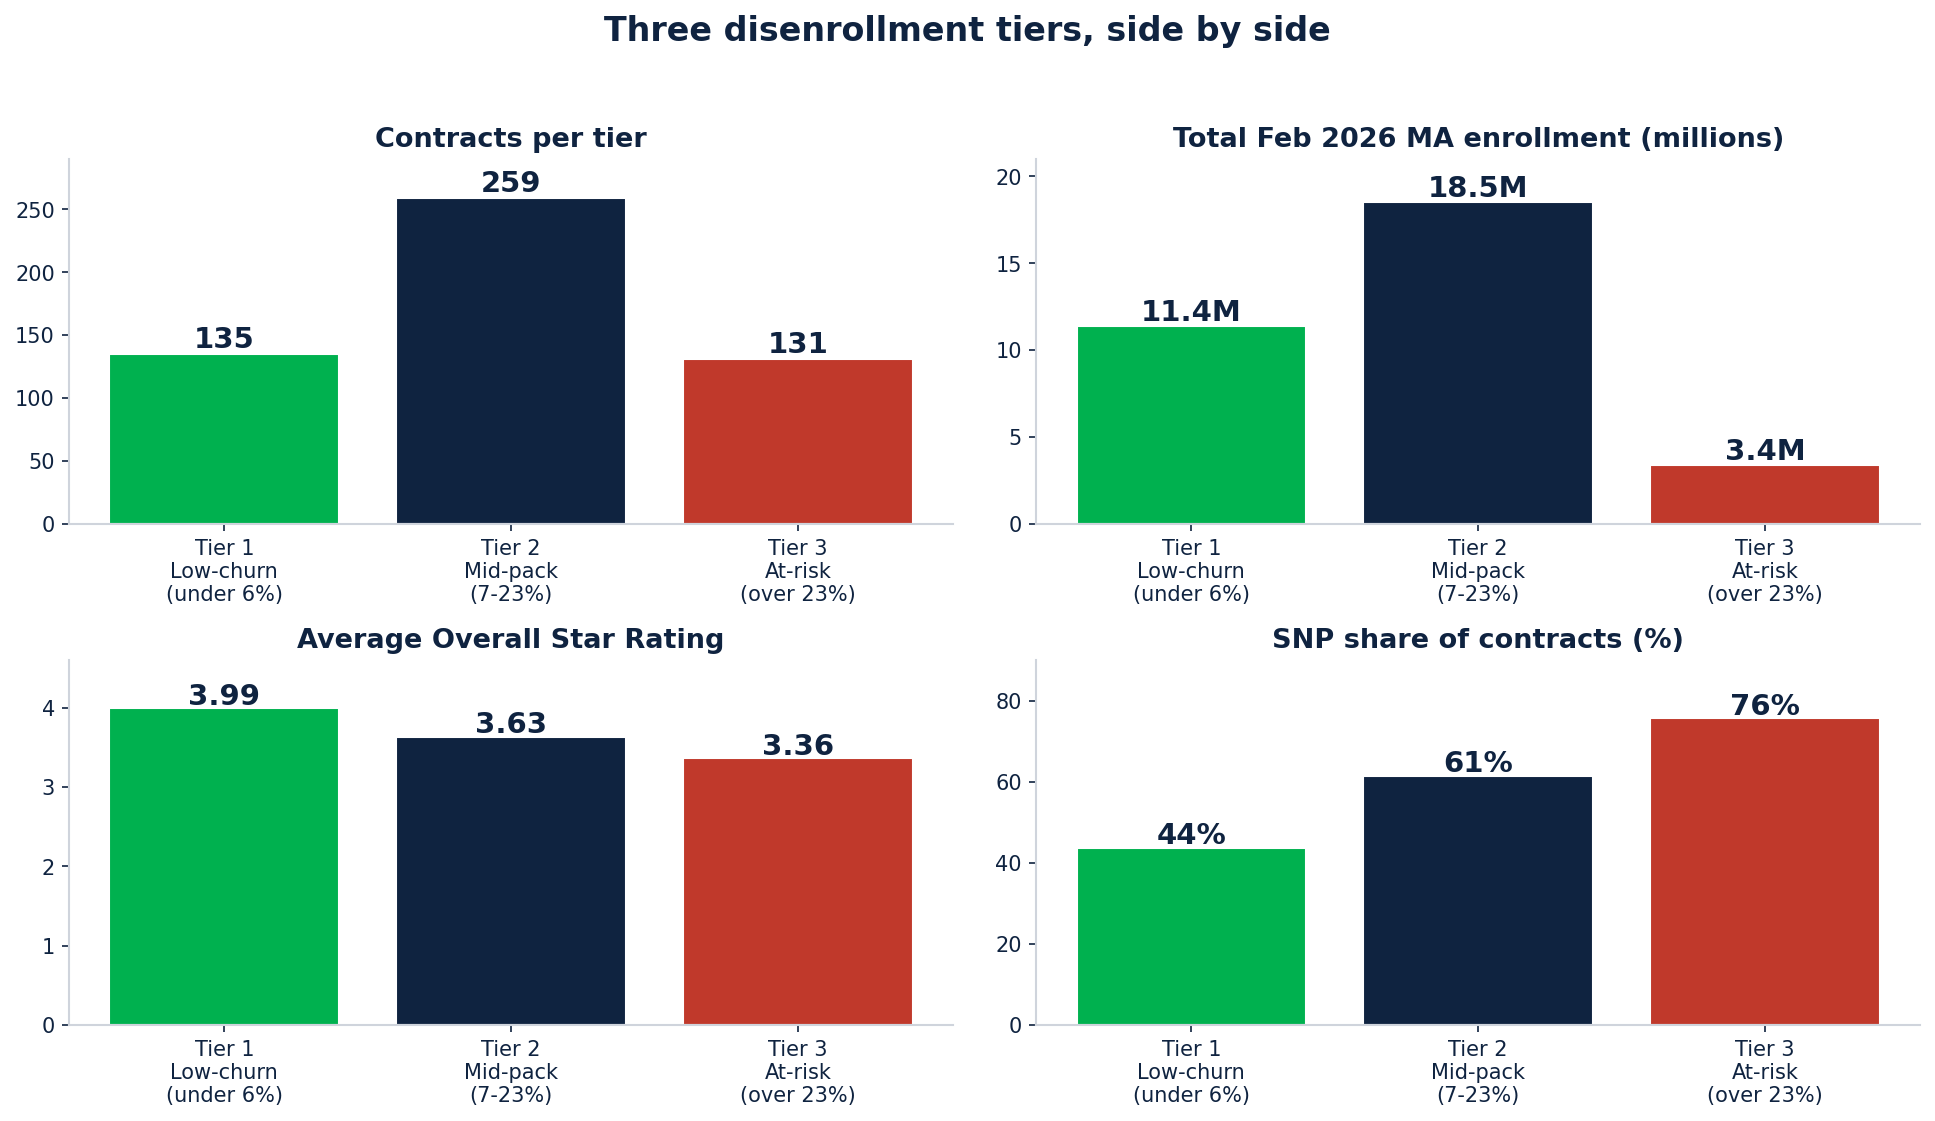
Three disenrollment tiers, side by side
What is striking is the imbalance in lives covered: Tier 1 holds 11.4M lives in 135 contracts. Tier 2 holds 18.5M in 259 contracts. Tier 3 holds only 3.4M in 131 contracts.
The biggest carriers (UnitedHealth, Humana, CVS / Aetna) skew toward Tier 2 because their large books include contracts at every performance level. Centene has 31 contracts in Tier 3 (the largest single-carrier at-risk concentration). Kaiser has 8 contracts entirely in Tier 1.
The premium paradox
Here is the surprising finding: low-churn plans charge more, not less.
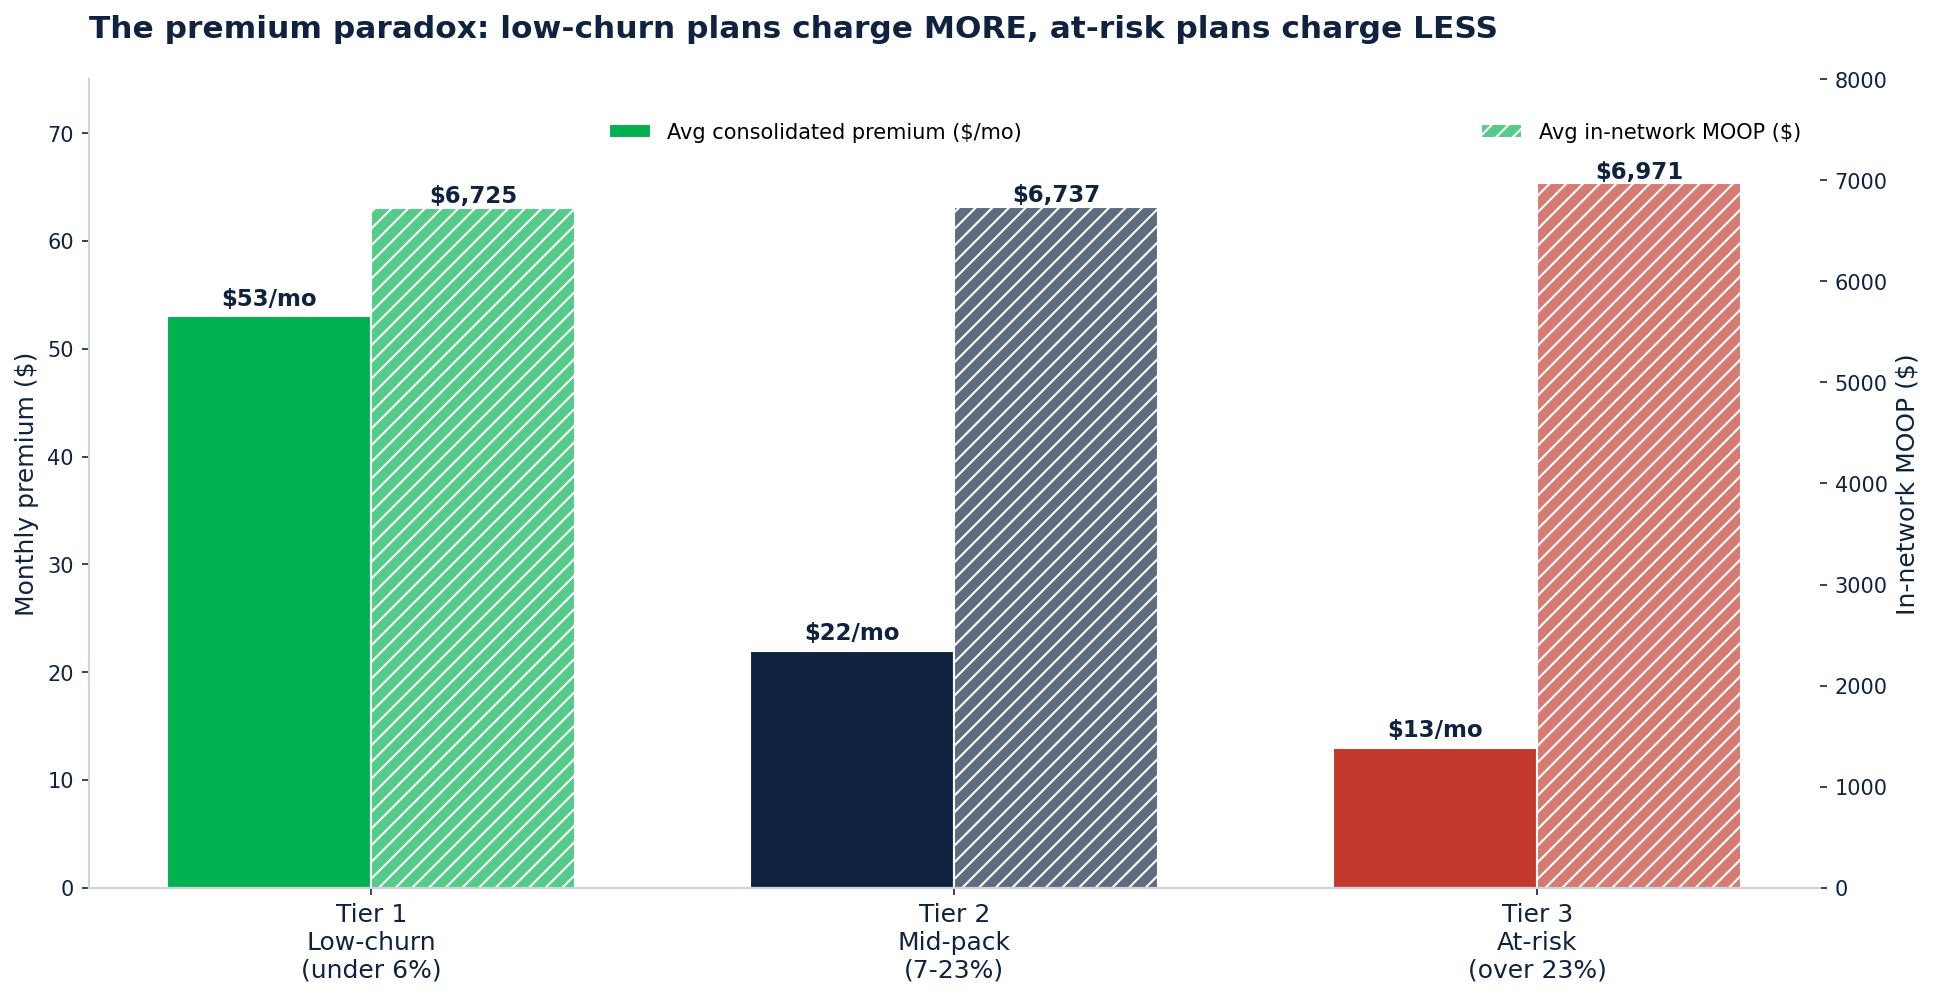
The premium paradox: low-churn plans charge MORE, at-risk plans charge LESS.
The average consolidated premium (Part C + D) is $53/month in Tier 1, $22/month in Tier 2, and $13/month in Tier 3. MOOP is roughly similar across tiers ($6,725 - $6,971).
The naive read says: "of course low-premium plans churn more, members are price-shopping." That's partly right. But the deeper read is that quality wins retention even when it costs more upfront. Kaiser, integrated regional BCBS systems, and top D-SNPs charge more because they deliver more — and members stay. At-risk plans are racing to $0 premium to fill the funnel and then bleeding members when the network friction or MOOP exposure hits.
Three carriers in Tier 1 (Kaiser, Lifetime Healthcare, UCare Minnesota) and several BCBS plans charge above $50 average consolidated premium AND keep disenrollment under 6%. They are proof that high price + high retention is possible if the integration is real.
Why members actually leave
The CMS Star Ratings publication breaks disenrollment into five reason categories. The dominant reason shifts as the tier worsens.
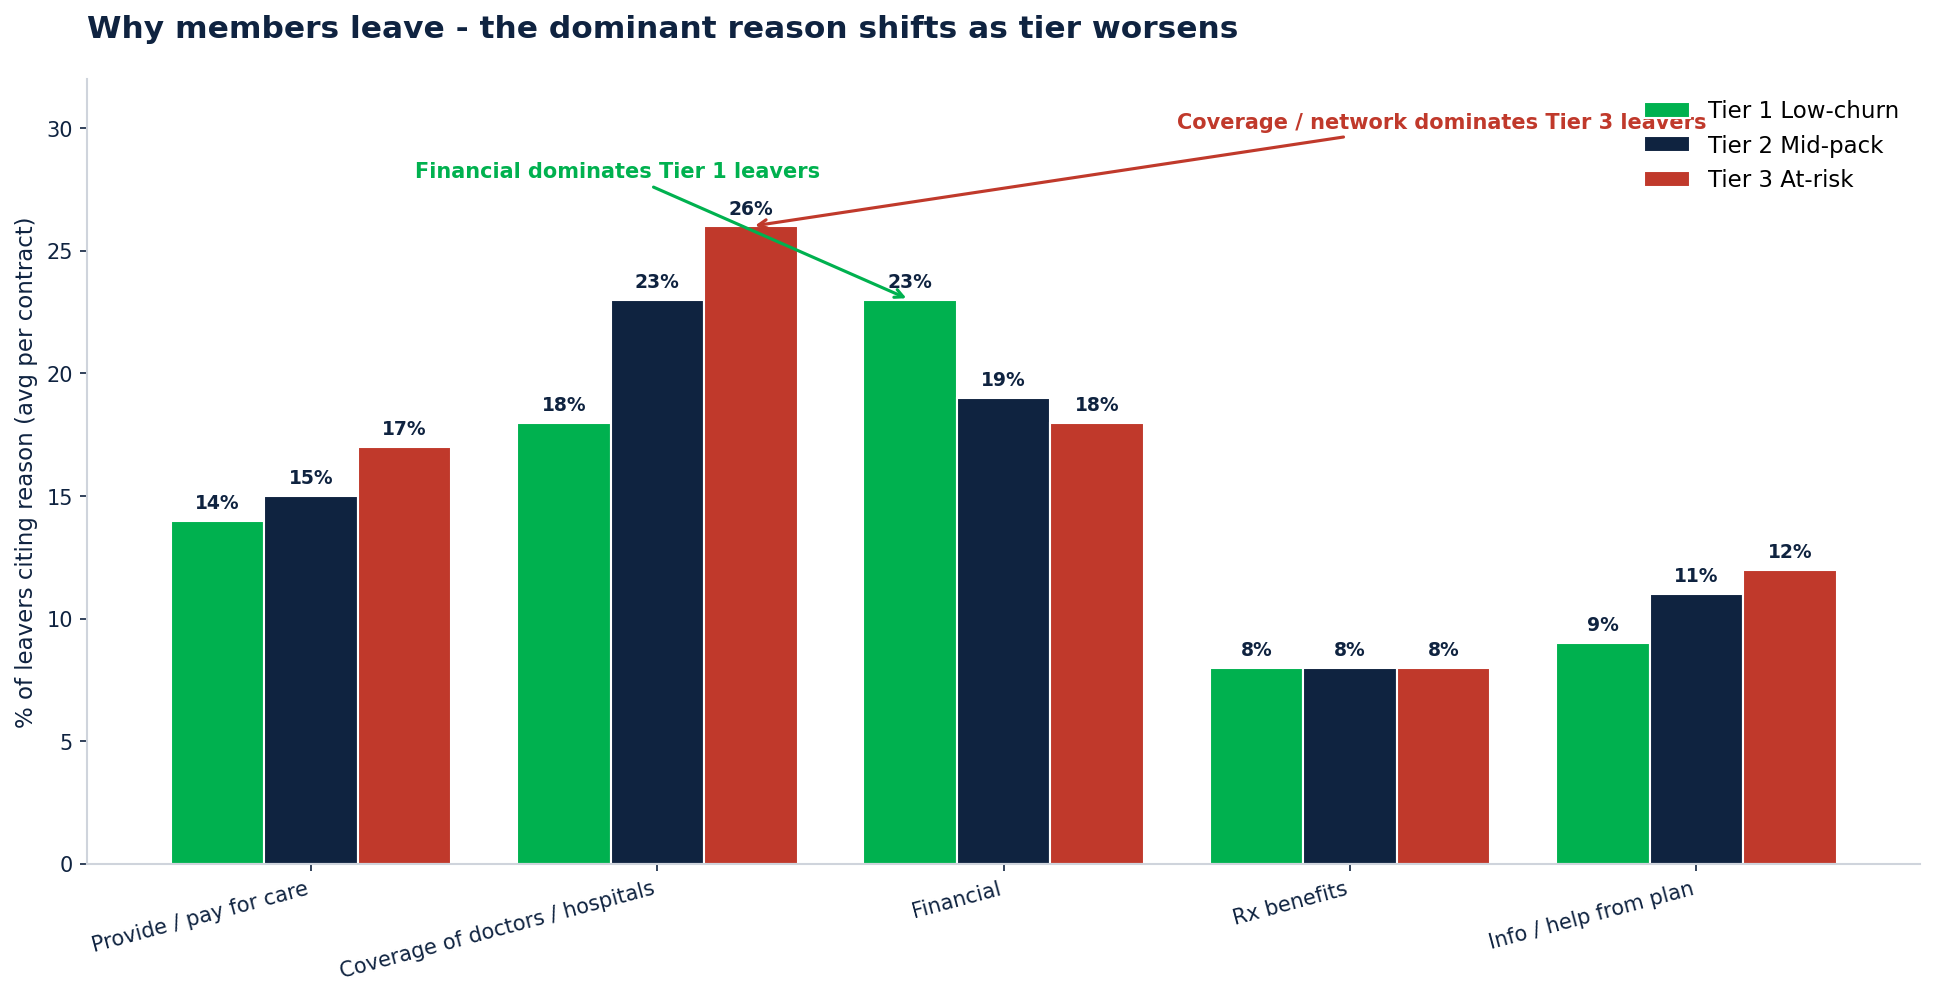
Why members leave - the dominant reason shifts as tier worsens
Tier 1 (low-churn) leavers: 23% cite financial reasons as the #1 driver. When the few who do leave a great plan leave, it's because someone else is cheaper.
Tier 2 (mid-pack) leavers: 23% cite coverage of doctors and hospitals as the #1 driver, with financial close behind at 19%. Network access starts to matter.
Tier 3 (at-risk) leavers: 26% cite coverage of doctors and hospitals — the highest of any tier. Information and help from the plan rises to 12%. Network and service problems compound.
The strategic implication: the bid lever depends on the tier. Tier 1 plans should defend their premium-quality positioning. Tier 3 plans should pour resources into network adequacy and provider directory accuracy. Tier 2 plans need to diagnose their specific reason mix before deciding whether to invest in premium or in network.
Star Ratings overlap
Star Ratings are correlated with retention, but not perfectly.
Tier 1: 63% of contracts at 4+ Star, 9 are 5-Star. Average 3.99.
Tier 2: 38% at 4+ Star, 6 are 5-Star. Average 3.63.
Tier 3: 16% at 4+ Star, 3 are 5-Star. Average 3.36.
Low-churn plans dominate the 4+ Star band at four times the rate of at-risk plans. Stars and retention reinforce each other: high stars yield rebates that fund supplemental benefits that retain members.
The one anomaly: even Tier 3 has three 5-Star contracts. They are likely small SNP-focused plans where high stars don't translate to retention because the underlying member churn (dual-eligible recertifications, life events) is structural. Not all disenrollment is fixable with bid design.
Scale matters
Tier 3 contracts are smaller, on average, than Tier 1 and Tier 2 contracts.
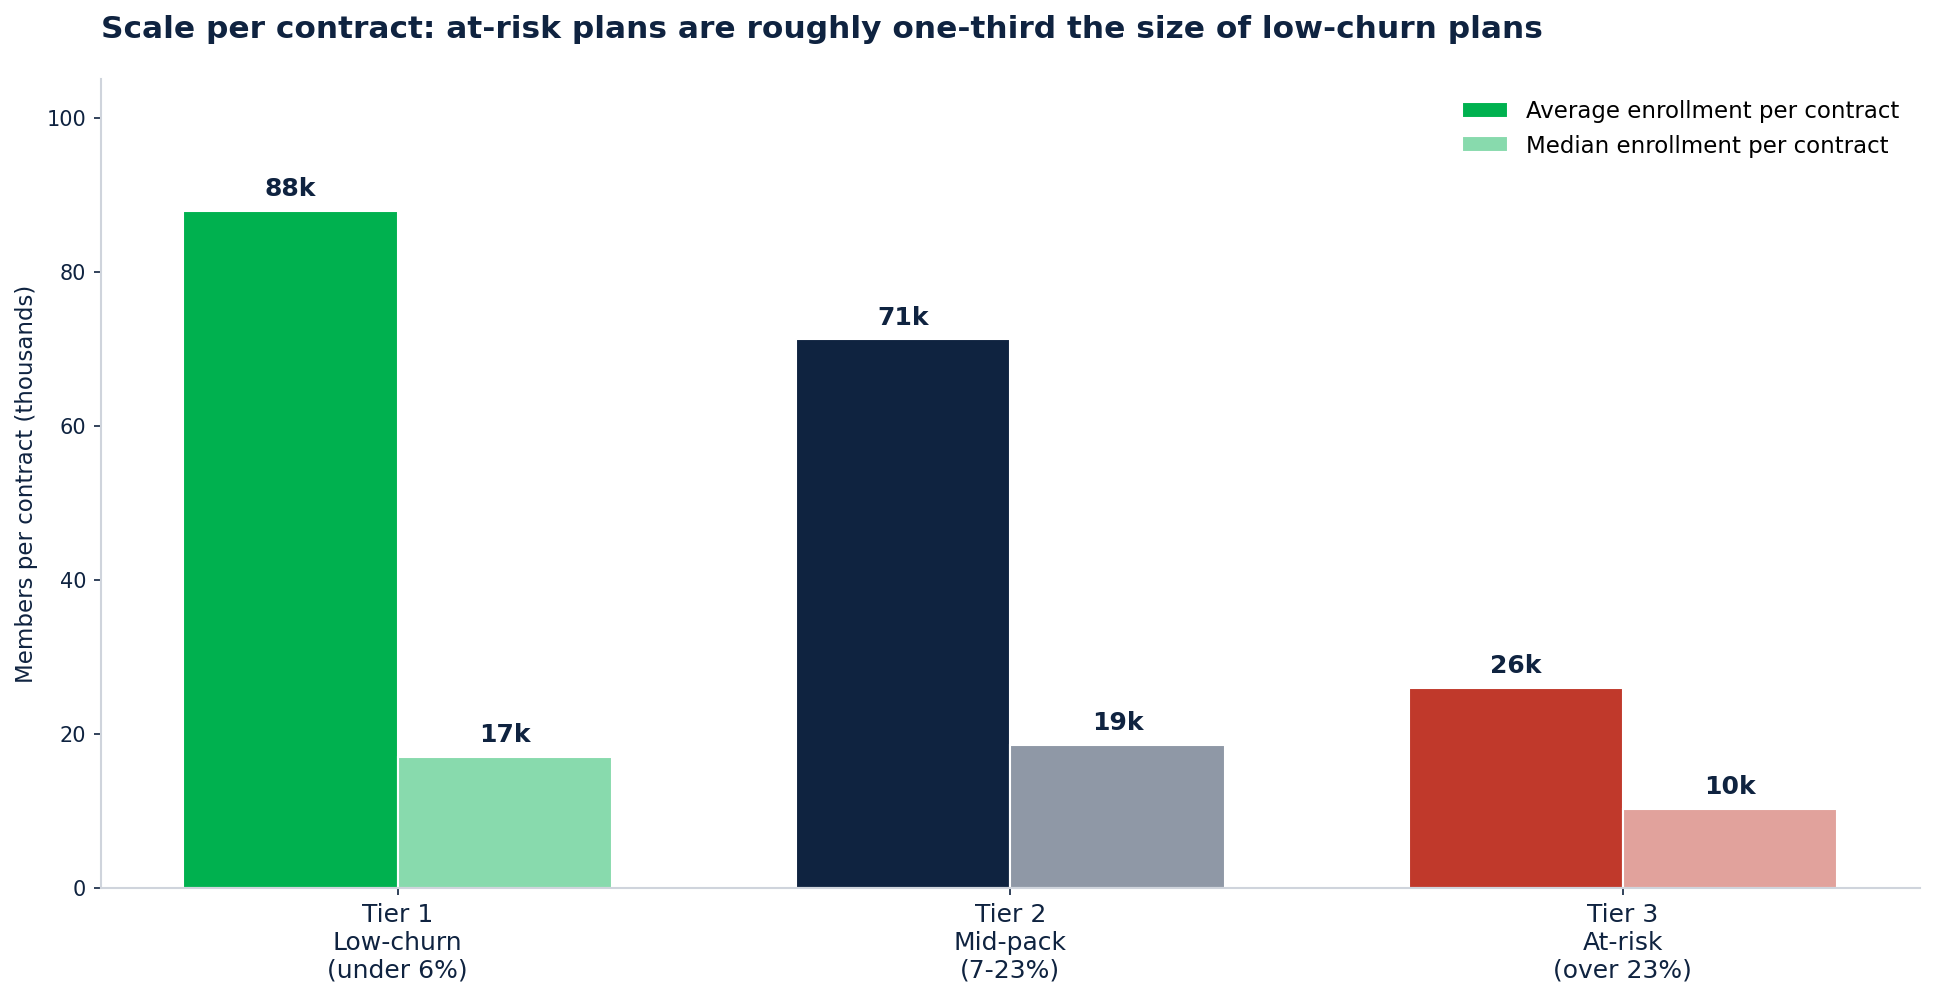
Scale per contract: at-risk plans are roughly one-third the size of low-churn plans
Average enrollment per contract: - Tier 1: 87,888 members - Tier 2: 71,241 members - Tier 3: 25,971 members
Median per contract is similar (17k / 18.6k / 10.2k). Subscale means thinner margins, less administrative leverage, fewer dollars for member experience, and a smaller talent pool. That's not destiny — Devoted Health and SCAN are subscale and growing — but it is a headwind.
For carriers running multiple Tier 3 contracts, the CY2027 bid is the right window to decide: invest to scale or consolidate out of subscale markets.
Five focus areas per tier
If you are in Tier 1 (Low-churn)
The risk is complacency. Tier 1 lost 5.4% of enrollment between Dec 2025 and Feb 2026 (the biggest single-tier drop), largely from carriers like UCare Minnesota, BCBS Michigan, and Highmark giving up markets. Even great plans get hit when the financial story slips.
Defend your premium-premium position. Your $53/month consolidated premium average is 4x the at-risk tier. Do not race to $0. Members are paying for quality.
Lock the financial-reason story. 23% of your leavers cite financial reasons. Drill down by Plan ID and find which specific products are losing on price in which counties.
Push for 5-Star. Tukey outlier removal compresses the 4.5-Star band more than the 5-Star band. The smart investment is leap-not-creep.
Make supplemental dollars visible. Tier 1 carriers tend to under-invest in OTC dollar visibility. Publish the envelope clearly so brokers can comp.
Time your geographic retreat right. If you are exiting markets, do it at AEP, not mid-year. Mid-year departures break trust.
If you are in Tier 2 (Mid-pack)
You are the median MA plan. 18.5M lives across 259 contracts. The bid-year question is whether to invest to climb into Tier 1 or accept Tier 2 and optimize margin.
Diagnose your reason mix. Mid-pack is bimodal — 23% leave for coverage and 19% leave for financial. Run the diagnostic per contract before you decide which lever to pull.
Use Star Ratings as the lever. Only 38% are at 4+ Star. The path to Tier 1 runs through Star, and CY2027 (measurement year 2025-26) is the lever year.
Audit network adequacy. Coverage is the #1 reason for Tier 2 leavers. Behavioral health network adequacy enforcement is intensifying — a compliance and retention play in one.
Look at your subscale plans. Some contracts have median enrollment below 18,000. Either consolidate operationally or invest to grow in your strongest counties.
Build retention-poaching capability. Tier 3 contracts in your states are bleeding members. They are in-market and pre-qualified. Target them in AEP 2026.
If you are in Tier 3 (At-risk)
Over 1 in 4 of your members leaves every year. Tier 3 is 76% SNP, so some churn is structural (dual recertifications, life events). But you are still well above the industry mean. The CY2027 bid is fix-or-fold.
Network adequacy is the #1 story. 26% of your leavers cite coverage of doctors and hospitals — the highest of any tier. Run a specialty / behavioral provider audit and recruit before AEP.
Catch up on SSBCI breadth. Industry benchmark for SSBCI is 5+ categories (Aetna) to 7+ (Humana). If you are below 3, you are giving competitors free retention plays.
Re-balance premium and MOOP. $13/month premium with $6,971 MOOP is not winning. You went low on premium but the high MOOP exposure becomes the story when members get sick. Find the right point on the curve.
Decide on fold-or-fix. Median Tier 3 contract has 10,239 members. If you cannot generate operating leverage at that scale, consolidation may be the answer. The CY2027 bid is the right window to decide.
Star Ratings recovery if you stay. Only 16% of Tier 3 are 4+ Star. The HEI methodology change in CY2027 actually helps SNP-heavy carriers (your dual / LIS share gets recognized). Invest in measurement-year 2025-26 quality activities.
The bigger picture
The 2.6M people whose plans terminated at the end of 2025 (KFF, March 2026) are a leading indicator. Plans got squeezed by V28 risk adjustment phase-in, IRA Part D bid math, and slower payment growth. The result was retreat: small insurers gave up markets, big insurers (UnitedHealth) exited counties, and Humana and Devoted picked up the slack.
The CY2027 bid year is the next inflection point. Plans that have not adapted their bid to the new economics, the new reason mix in their member base, and the new Star Ratings methodology will find themselves one tier worse in the CY2028 disenrollment publication.
The tier you are in today is not destiny. But the bid lock on June 1 is.
Carelytics Internal Analytical Platform was built on multi-year CMS Star Ratings, CPSC enrollment, Landscape files and MLR Data Release files. For any questions related to this analysis or for information specific to a health plan, reach out to us at Contact us.